Financial statements are structured records summarizing a business's financial position, performance, and cash flows for a specific period. These key indicators in the eyes of Investors, creditors, and upper management of the company to evaluate the profitability, liquidity, and stability of any entity.
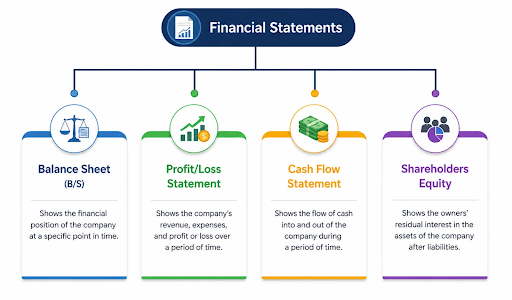
A balance sheet provides information about a financial position by detailing its Assets, liabilities, and shareholders' funds. Accounting Payable (AP) and accounts receivable (AR), which represent inflows and outflows of money, respectively. Accounts Payable (AP) is a current liability that represents money owed to the suppliers/vendors. Accounts receivable (AR) is a current asset that represents money owed by customers or buyers.
Accounts Payable (AP) is the short-term liability representing money a business owes suppliers for goods or services bought on credit. Recorded on the balance sheet, it represents unpaid invoices due within 30 to 90 days. Effective AP management ensures timely payments, manages cash flow, and maintains positive vendor relationships.
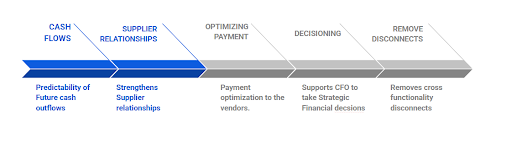
Forecasting accounts payable helps predict future supplier payments, enabling businesses to plan cash flow, avoid late fees, and maintain strong supplier relationships. It ensures sufficient liquidity to meet financial obligations, promoting stability and efficient financial management.
Cash Conversion Cycle (CCC) plays a vital role in AP forecasting, it gives the finance team a clear data flow of time taken from the shopfloor to the sale of goods to the customer.
Cash Conversion Cycle (CCC),
CCC = DIO + DSO - DPO, where,
DIO = Days Inventory Outstanding,which gives an idea of the average number of days to sell the inventory.
DSO = Days Sales Outstanding,Average number of days to collect payment from the customers.
DPO = Days Payable Outstanding,Average number of days to pay the Vendors/Suppliers.
Illustration of CCC with Example:
DIO = 40 days, the inventory is held with the company.
DSO = 20 days to collect cash from the customers.
DPO = 35 days is the time taken to pay Suppliers.
CCC= DIO+DSO-DPO,
CCC= 40+20-35
CCC = It takes 25 days for the company to turn its inventory investment into Cash.
The lower the CCC is better for the company.
Effectively forecasting accounts payable directly affects your working capital management. When you know exactly when payments are due, you can maintain optimal cash reserves without tying up excess funds. The result is better cash-flow predictability and clearer operational visibility, with more money available for growth opportunities, emergencies, earning interest, or operational investments.
Forecasting accounts payable connects to your broader business strategy by providing visibility into future cash needs. This insight informs decisions about expansion timing, inventory purchases, and hiring. You can pursue growth initiatives with confidence when you have a clear view of your payment obligations.
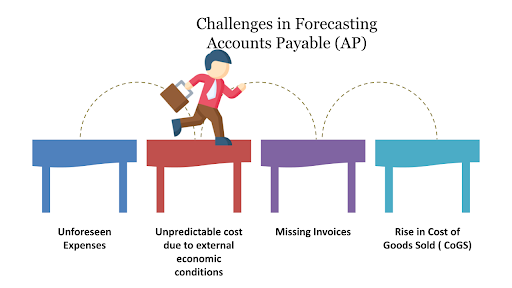
Forecasting Accounts Payable (AP) is inherently challenging due to multiple unpredictable and often disconnected factors that impact financial visibility. Organizations frequently struggle with unforeseen expenses that arise without warning, making it difficult to maintain accurate cash flow projections. This is further complicated by fluctuating costs driven by external economic conditions, such as inflation or supply chain disruptions, which can rapidly alter payable amounts. Additionally, missing or delayed invoices create gaps in data, leading to incomplete or inaccurate forecasts. On top of this, a rise in the cost of goods sold (CoGS) adds another layer of uncertainty, as increasing procurement costs directly influence payables. Together, these challenges make AP forecasting a complex and dynamic process that requires more intelligent, real-time, and data-driven approaches.
AP forecasting methodologies differ based on the short-term and long-term priorities.
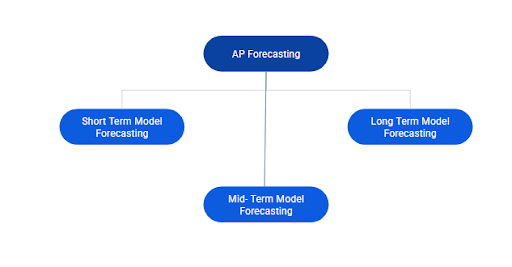
1. Accounts Payable Ageing report:
An AP aging report groups supplier invoices by the length of time they’ve been unpaid. It’s a relatively quick way to see which transactions require immediate attention and which can be deprioritized. The common practice is to separate invoices in the report into several time ranges
| Vendor | Current | 1-30 days | 31-60 days | 61-90 days | 90+ days | Total |
|---|---|---|---|---|---|---|
| Vendor A | Rs. 10,000 | Rs. 90,000 | 0 | 0 | 0 | Rs. 100,000 |
| Vendor B | 0 | 0 | Rs. 125,000 | 0 | 0 | Rs. 125,000 |
| Vendor C | Rs. 25,000 | 0 | Rs. 45,000 | Rs. 20,000 | 0 | Rs. 90,000 |
| Vendor D | 0 | 0 | 0 | 0 | Rs. 25,000 | Rs. 25,000 |
| Vendor E | Rs. 35,000 | Rs. 96,000 | Rs. 85,000 | Rs. 76,000 | Rs. 54,000 | Rs. 346,000 |
From the above table, we are able to infer that Vendor A and Vendor B invoices are Current and within 30 days, and Vendor E invoices are at an alarming rate, where the invoices are not getting processed on time.
1. 13 Week Rolling forecast:
A 13-week forecast is a practical way to see supplier payments week by week for roughly the next three months. The forecast is initially built based on the weekly or bi-weekly payment schedules. The team lists outstanding invoices, upcoming payment dates, and expected expenses. As the next week rolls around, you replace last week’s estimate with what was actually paid and push delayed items to the following week.
1. Cash Flow Budgeting:
Cash flow budgeting includes accounts payable as part of a monthly or quarterly plan, alongside payroll and revenue. The purpose is to see how all expected cash inflows and outflows affect the company’s balance sheet.
Instead of trying to predict the exact payment date of every invoice, teams start from the spend planned in the P&L statement. They then estimate when that spend will turn into cash payments using payment terms and average delays (for example, how long the company usually takes to pay suppliers).
The AP teams follow a similar approach to the 13-week forecast. Each month or quarter, they replace estimates with actual results and update assumptions, so the forecast stays relevant without starting from scratch.
1. DPO-based forecasting:
A company’s Days payable outstanding refers to the average number of days it takes for a company to pay its vendors after receiving invoices. Before we delve into DPO-based forecasting, it is essential to understand what the Cost of Goods Sold (CoGS)
CoGS = Opening Stock + Purchases- Closing Stock
DPO = Average accounts Payable/Cost of goods sold* 365
Illustration:
AP= Rs. 120000; CoGS= Rs. 1000000
DPO = 120000/1000000*365
DPO = 43 days.
Hence, the company pays its vendors on the 43rd day after receiving the invoice. Let's assume Forecasted CoGS is Rs. 1200000. Then the Forecasted AP will be as follows; Forecasted AP = Forecasted CoGS/No of days* Forecasted DPO
Forecasted AP = (1200000/365)43
Forecasted AP = Rs. 141370.
2. Regression and Trend-Based Models:
Regression and trend models look at past data to see how accounts payable transform as the business evolves. Teams compare AP to factors such as purchase volume or cost changes, then use those patterns to estimate future balances.
For example, the data might show that specific categories are consistently left unpaid for longer periods due to their payment terms. Such methods give you an understanding of why AP changes, but they don’t estimate when specific invoices will be paid.
3. Total Accounts Payable Turnover:
This metric helps gauge the efficiency of your AP management by analyzing your total purchases against your accounts payable.
Formula: The TAPT is calculated by dividing your total purchases by the average of your beginning and ending AP for a period. This average is then divided by 365 to determine the average accounts payable days, also known as Days Payable Outstanding (DPO).
TAPT = Total Purchases ÷ Average Accounts Payable
Let us assume, Total purchases = Rs. 2500000 and Average Accounts Payable = Rs. 1600000
TAPT = Rs. 2500000/1600000
Over the fiscal year, the company's AP turned over 1.56 times during the year.
After evaluating the Accounts Payable environment, the following enhancements are recommended to strengthen forecasting and automation capabilities within iAPX
1. Integrate Cash Conversion Cycle (CCC) Tracking
Introducing Cash Conversion Cycle (CCC) as part of the platform will provide the finance team with a complete view of cash flow movement. This enables better liquidity planning, improved working capital management, and more accurate AP forecasting.
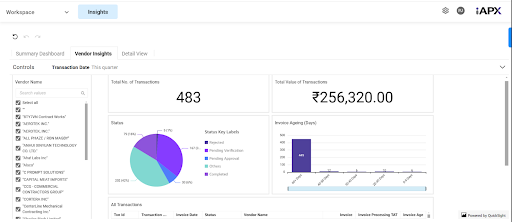
2. Supplier Risk Scoring Based on GST Compliance
Develop a supplier risk-scoring model based on factors such as GST filing frequency, compliance consistency, and filing delays. This will help both AP and procurement teams proactively monitor vendors, reduce risk exposure, and improve supplier governance.
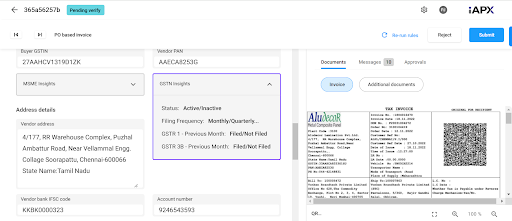
3. Invoice Approval Workflow for Managers
Enable managers to review and approve invoices directly through iAPX. This will accelerate approval cycles, improve visibility, and reduce delays in payment processing.
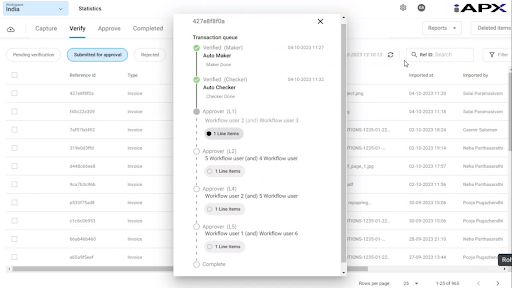
4. Dynamic Invoice Routing
Implement intelligent invoice routing based on predefined criteria such as invoice amount, department or business unit, supplier risk score, and approval hierarchy. This ensures invoices are automatically directed to the right stakeholders, improving efficiency and control.
In today’s dynamic business environment, forecasting accounts payable with accuracy is no longer a back-office exercise—it is a strategic imperative. Organizations that rely on traditional, manual approaches often struggle with fragmented data, delayed visibility, and unpredictable cash flows. By combining structured forecasting methodologies with intelligent automation, businesses can significantly improve accuracy, reduce risk, and enhance financial control.
Platforms like iAPX enable this transformation by integrating real-time insights, streamlined workflows, and predictive capabilities, empowering finance teams to move from reactive operations to proactive decision-making. Ultimately, intelligent AP forecasting not only strengthens working capital management but also builds a foundation for resilient, scalable, and future-ready enterprises.